“`html
Why Wearables Revolutionize Distance Training
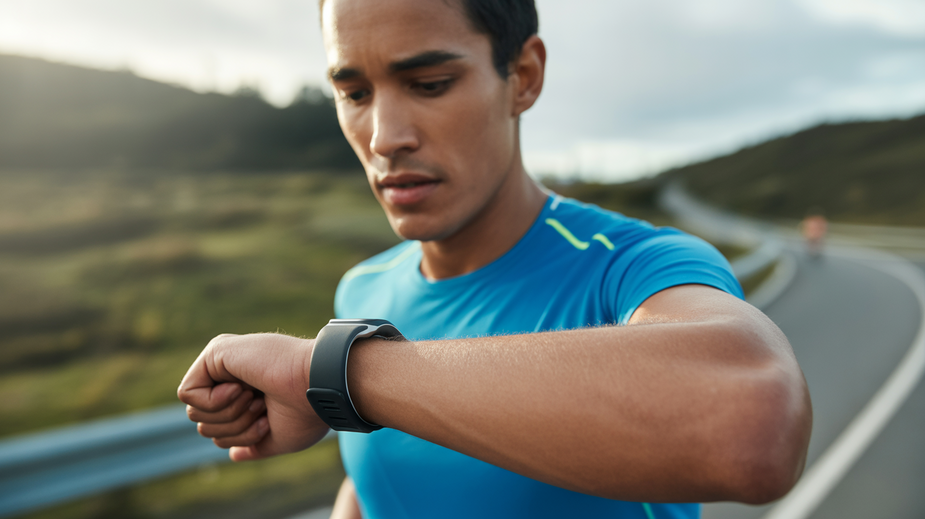
For years, distance running training, including preparing for a half marathon, relied heavily on subjective feel. Runners would gauge their effort, listen to their bodies, and adjust training based on perceived fatigue or performance. While intuition remains a crucial element, the advent of affordable and sophisticated wearable technology has fundamentally changed the game, ushering in an era of data-driven training. These devices don’t replace the runner’s connection with their body, but they provide an invaluable layer of objective insight that can significantly enhance training effectiveness and safety. 📈
Wearables like GPS watches, heart rate monitors, and running dynamics sensors effectively bridge subjective effort with objective performance data. You might feel like you’re running fast, but the data confirms your actual pace. You might feel recovered, but your resting heart rate or HRV metric suggests otherwise. This constant feedback loop allows for a much more accurate understanding of your body’s response to training, moving beyond guesswork and towards precise analysis. This objective perspective is vital for making informed decisions about your daily runs and overall training load. For more on the role of data in sports science, see resources like this article on data-driven training from TrainingPeaks.
Crucially, wearable data can help identify invisible bottlenecks in training efficiency. Issues like inconsistent pacing, excessive ground contact time, or suboptimal cadence might not always be apparent through feel alone. Analyzing metrics recorded by your device can highlight these areas for improvement. Are you pushing too hard on easy runs? Is your stride potentially inefficient? Are you consistently getting poor sleep? Wearables provide the quantitative evidence needed to spot these subtle but impactful factors that could be hindering your progress or increasing injury risk during half marathon preparation. 🔍
Ultimately, the most significant impact of wearables is their ability to enable personalized adjustments through continuous tracking. As you train consistently, your wearable builds a rich history of your performance and recovery data. This personal baseline allows coaches (or motivated self-coached runners) to tailor training plans dynamically. If your data shows you’re recovering well, you might handle a slightly harder session. If fatigue metrics are high, backing off might prevent overtraining. This isn’t about following a static plan but creating a responsive, individualized journey that adapts to how your body truly responds, maximizing gains and minimizing setbacks on your path to the half marathon start line. 💪
Critical Metrics Most Runners Misinterpret
Wearable technology offers unprecedented insight into your body’s responses during training by providing a wealth of data. However, simply tracking numbers isn’t enough; correct interpretation is paramount. Many common metrics, seemingly straightforward, are frequently misunderstood by runners, leading to suboptimal training decisions or missed recovery signals. Let’s clarify some of the most critical ones. 🤔
One common pitfall is confusing heart rate spikes with fitness gains. While a high heart rate indicates high effort at that moment, consistently hitting maximal heart rates doesn’t inherently mean you’re getting fitter. Often, elevated heart rates can signal fatigue, dehydration, illness, or simply a challenging pace for your current level. True fitness gains are often reflected in your heart rate response over time: a lower heart rate for the same pace or effort, and a quicker return to resting heart rate post-workout. Focus on trends and context, not just peak numbers during a single run. ❤️
Another metric often overvalued is daily step counts over workout quality. Hitting 10,000 steps is a great goal for general activity and overall health, but it doesn’t substitute for structured running training aimed at improving specific physiological systems required for a half marathon. Walking steps contribute minimally to the aerobic and muscular adaptations needed for sustained running performance. Workout quality – focusing on specific paces, durations, and intensities during dedicated runs – is far more critical for race preparation than accumulating random steps throughout the day. 👟
Finally, many runners miss crucial recovery signals in sleep data patterns. Your watch tracks sleep duration, stages (light, deep, REM), and sometimes disturbances. Consistently poor sleep quality or duration isn’t just about feeling tired; it severely impairs muscle repair, hormone regulation, and energy replenishment – all vital for adapting to training stress. Missing recovery signals in your sleep data, such as reduced deep sleep or increased disturbances, means you’re potentially accumulating fatigue and increasing injury risk, even if you’re hitting your planned mileage. Pay close attention to these patterns as a key indicator of your body’s readiness for the next hard session. You can find more information on sleep and its importance from resources like the CDC’s guide to sleep. 😴
Understanding the true meaning behind these metrics, rather than relying on superficial interpretations, is key to unlocking the power of your wearable data for effective half marathon training.
Heart Rate Zones: Your Effort Compass
One of the most fundamental metrics your wearable device can track is your heart rate, and understanding your heart rate zones acts as a powerful effort compass, guiding the intensity of your training runs. Instead of relying solely on perceived effort or pace, zones provide an objective window into how hard your cardiovascular system is working. ❤️🧭
While many devices offer generic zone calculations based on age, these are notoriously inaccurate. For truly effective, personalized training, you need to define your zones based on a more reliable physiological marker like your lactate threshold (LT). Your LT is the intensity level where lactate begins to accumulate in your bloodstream faster than your body can clear it – a strong indicator of your sustainable hard effort. Determining your LT can be done through a controlled field test (like a maximal 30-minute time trial) or a professional lab test. Once you have this number, you can set heart rate zones that accurately reflect your unique physiology. For more on LT testing, check out resources like this: Understanding Your Lactate Threshold.
Aligning your training with specific heart rate zones is where the real magic happens. Different zones contribute to different physiological adaptations and should be targeted for specific types of workouts.
Here’s a basic breakdown of how you might map zones to training goals:
| Zone | Effort Level | Training Goal | Example Workout |
|---|---|---|---|
| Zone 1 & 2 | Very Easy to Easy | Recovery, Aerobic Base Building | Easy Run, Long Slow Distance |
| Zone 3 | Moderate | Tempo, Steady State (Caution Zone) | Steady Run (Use Sparingly) |
| Zone 4 | Hard | Threshold, Endurance | Tempo Run, Longer Intervals |
| Zone 5 | Very Hard | Speed, VO2 Max | Short Intervals |
Crucially, pay attention to the Zone 3 or moderate effort zone. Often dubbed the “grey zone,” spending excessive training time here can actually hinder your progress. This is because it’s often too hard for optimal recovery and building a strong aerobic base (which primarily happens in Zones 1 & 2), yet not intense enough to elicit the powerful adaptations required for significant speed and VO2 max gains found in Zones 4 and 5. A more polarized training approach, emphasizing significant time in the lower zones and dedicated time in the higher zones while minimizing Zone 3, is often more effective for long-term adaptation and improved half marathon performance.
Running Dynamics: Cadence & Ground Contact
Beyond pace and heart rate, modern wearables offer deeper insights into your running form, known as running dynamics. These metrics can reveal subtle inefficiencies and potential injury risks that aren’t apparent just by looking at splits. Understanding and tracking these can be a game-changer for your half marathon training efficiency and sustainability. 🏃💨
One fundamental dynamic is Cadence, measured in steps per minute (SPM). While the often-cited 180 SPM is a general guideline, the ideal cadence is highly individual. Tracking your cadence helps you identify if you might be overstriding, a common issue where your foot lands too far in front of your body. Increasing your cadence, often by focusing on shorter, quicker steps, can help reduce impact forces and improve running economy, making each stride more efficient.
Another critical metric is Ground Contact Time (GCT). This measures the duration your foot spends on the ground with each step. Shorter ground contact time generally indicates a more efficient push-off and less time spent absorbing impact. Elite runners typically have very short GCTs, often under 200 milliseconds, while recreational runners might be higher. Reducing GCT can contribute to faster speeds and decrease the cumulative impact on your joints over the long distance of a half marathon.
Finally, Vertical Oscillation (VO) measures how much you bounce up and down with each stride. While some vertical movement is natural, excessive vertical oscillation indicates wasted energy that could be directed towards forward motion. A lower vertical oscillation number relative to your speed suggests you are using your energy more efficiently to move horizontally rather than vertically. Monitoring VO helps you assess if your form is propelling you forward smoothly or if you’re expending unnecessary effort bouncing.
By analyzing your wearable data on cadence, ground contact time, and vertical oscillation, you gain actionable insights to refine your running form. Focused drills or simply being mindful of these numbers during training runs can lead to improvements in efficiency, potentially reducing fatigue and lowering the risk of common running injuries as you build up mileage towards your half marathon goal. 🛠️
Recovery Metrics That Predict Progress
Training for a half marathon isn’t just about the miles; it’s profoundly about how well you recover. Adaptation, the process that makes you stronger, happens during rest. Your wearable device offers valuable insights into your recovery status, providing metrics that can help you make smarter decisions about your training load and timing. Using these metrics prevents overtraining, injury, and burnout. ✅
To better understand the crucial role of recovery data, watch this helpful video explaining one of the key metrics:
One powerful metric is Heart Rate Variability (HRV). This measures the beat-to-beat variations in your heart rate, not the average heart rate itself. Higher HRV is often associated with a recovered state, while lower HRV can indicate stress, fatigue, or illness. Tracking trends in your HRV over time, rather than daily numbers, gives a more reliable picture of how your body is adapting. Declining trends might signal a need for more rest, while improving trends indicate good adaptation. For a deeper understanding, explore this explanation of HRV from Harvard Health. ❤️📉📈
Another foundational metric is your Resting Heart Rate (RHR). This is the number of times your heart beats per minute when you are at rest, typically measured first thing in the morning. An unexpected spike in your RHR compared to your baseline is often a clear sign that your body is not fully recovered or is fighting off illness. While your RHR decreases with improved fitness, monitoring daily fluctuations provides a simple indicator of accumulated fatigue. 😴❤️
Many modern wearables also provide composite scores, like “Body Battery,” “Readiness Score,” or similar. These integrate data from HRV, sleep quality, activity, and recent training load into a single, easy-to-understand score representing your overall readiness to train hard. A low score might suggest a rest day or easy session, while a high score indicates you’re primed for a challenging workout. Using these scores for load management helps prevent pushing too hard when your body isn’t ready, optimizing both performance and injury prevention.🔋📊
Here’s a quick overview of how these metrics can guide your training decisions:
| Metric | What it Indicates for Recovery | How to Use It |
|---|---|---|
| HRV (Trends) | Autonomic nervous system balance, stress/recovery status. | Track trends: Declining = fatigue; Improving = good adaptation. Guides intensity. |
| Resting HR | Simple fatigue/illness indicator. | Monitor daily: Elevated above baseline = potential fatigue. Suggests caution or rest. |
| Readiness Score | Composite view of overall recovery/energy levels. | Use score daily: High score = good to go; Low score = prioritize rest/easy activity. |
Paying attention to these recovery metrics is just as vital as tracking pace and distance. They offer objective data points that complement how you feel, empowering you to train smarter, recover better, and ultimately perform your best on race day. 🏁
Race-Specific Data Modeling Techniques
Your training data isn’t just for understanding past workouts; it’s a powerful tool for predicting and optimizing your performance on race day. By applying data modeling techniques specifically tailored to the demands of your target half marathon, you can build a more robust and realistic race strategy, reducing guesswork and boosting confidence. 📊🎯
One crucial technique is simulating course demands using elevation-adjusted pace. Your wearable can track elevation changes during training runs, and many platforms offer grade-adjusted pace (GAP) metrics. This data helps you understand how much effort a specific pace on a hill requires compared to flat ground. Analyzing this allows you to predict realistic split times for hilly sections of your race course and build a pacing plan that accounts for the terrain, ensuring you don’t burn out on early climbs or go out too slow on flats. ⛰️⏱️
Understanding your individual fueling and hydration needs is also vital. Sweat rate analytics provide an objective way to estimate how much fluid you lose under specific conditions. By weighing yourself before and after runs of known duration and intensity, tracking fluid intake during the run, and noting temperature/humidity, you can calculate your estimated sweat rate per hour. For example, (Pre-run weight – Post-run weight + Fluid consumed) / Time = Sweat Rate. Knowing your sweat rate helps you plan your fluid and electrolyte intake during the race to prevent dehydration and maintain performance, especially in warmer conditions. Learn more about calculating sweat rate. 💧☀️
Finally, you can build your pacing strategy from historical fatigue curves. Your training data provides insights into your endurance limits and how your body typically responds to prolonged effort. By analyzing data from your long runs – such as pace drop-off over time, heart rate drift at a consistent pace, or changes in recovery metrics after hard efforts – you can identify patterns in how quickly you fatigue. This historical perspective helps you set a realistic starting pace for your race and predict how well you can sustain it, minimizing the risk of hitting the wall by understanding your typical endurance profile.📉
By integrating these data-driven techniques – considering elevation, calculating sweat rate, and analyzing historical fatigue trends – you move beyond generic advice and create a personalized race plan that leverages your unique physiological data for optimal performance on the big day. 🏆
Avoiding Analysis Paralysis: Data Filtering
Collecting data from your wearable is incredibly valuable, but let’s be honest: it’s also easy to fall victim to Analysis Paralysis. You have access to a wealth of information – heart rate, pace, cadence, sleep patterns, HRV, recovery scores, training load, and more. Staring at dashboards, constantly checking numbers, and trying to decipher every fluctuation can quickly become overwhelming and counterproductive. The goal of data-driven training isn’t to track everything, but to effectively filter and focus on the metrics that genuinely inform your progress and decision-making for your half marathon journey. 🤯➡️🧘
The first critical step in avoiding data overload is to prioritize. You don’t need to obsess over dozens of data points daily. Identify 3-4 key metrics that are most relevant to your training goals and your current training phase. For instance, if you’re building base endurance, focus might be on heart rate zones and overall training load. If you’re sharpening for speed, metrics like cadence, ground contact time, and race-specific pace become more crucial. Choosing a limited set of metrics allows you to concentrate your attention and make the data manageable and meaningful. ✅📊
Once you’ve selected your core metrics, the next step is establishing baseline ranges. A single day’s number tells you little without context. Understand your typical resting heart rate range when you feel recovered, your average HRV trend, or your usual sleep duration and quality over a consistent period. Track these numbers when you are feeling healthy and training steadily to understand what’s ‘normal’ for you. When you see a meaningful deviation from this personal baseline – perhaps a significantly elevated resting HR, a sharp drop in HRV, or consistently poorer sleep quality – it provides a powerful signal that something might be off, whether it’s accumulated fatigue, impending illness, or inadequate recovery. 📉📈
Finally, to truly make data work for you without becoming a chore, implement scheduled data reviews. Avoid the trap of constant, daily checking which can foster anxiety. Instead, set aside a specific time each week, perhaps on a rest day or during your easy run, to review the trends in your prioritized metrics over the past seven days or even longer. How is your training load progressing? Are your recovery metrics trending in the right direction? Are you hitting your target pace in specific heart rate zones? Looking at the bigger picture reveals patterns that are far more insightful than daily noise and allows you to make informed adjustments to your training plan proactively. 🗓️👀
By being selective about which data you focus on, understanding your personal normal ranges, and reviewing trends weekly rather than daily, you can transform your wearable’s output from a source of stress into a highly effective tool that guides your training with precision and confidence towards your half marathon goals.
Next-Gen Wearables: Predictive Race Readiness
As training technology evolves, wearables are moving beyond simply tracking past performance. The next wave of devices and software leverages advanced analytics and artificial intelligence (AI) to offer insights that are not just retrospective, but predictive. These tools are designed to help you anticipate challenges and optimize your preparation, making your training smarter and your race day more predictable. ✨🔮
One exciting area is AI-powered injury risk forecasting. By analyzing vast amounts of data – including training load, recovery metrics, running dynamics, and even historical injury patterns – sophisticated algorithms can identify subtle patterns indicating increased susceptibility to injury. Instead of waiting for the first twinge of pain, you might receive a warning sign days or weeks in advance, allowing you to proactively adjust your training, incorporate extra recovery, or focus on specific strength work. This shifts the focus from reacting to injuries to actively preventing them. 🤕➡️🛡️
Another cutting-edge metric is real-time muscle oxygen adaptation guidance. Devices measuring muscle oxygen saturation (SmO2) provide a direct look into how well your working muscles are utilizing oxygen during a run. Unlike heart rate, which responds systemically, SmO2 offers localized feedback. Monitoring this in real-time can help you understand your body’s immediate response to effort, guiding your pacing during demanding intervals or long runs to optimize aerobic adaptation and avoid pushing into unsustainable zones too early. Companies like Moxy Monitor are pioneering this field.🩸💡
Finally, future wearables are enhancing environmental impact simulations for race conditions. These tools integrate real-time weather data, forecasts, and detailed course profiles (including elevation and terrain) to predict how environmental factors like heat, humidity, wind, and altitude will affect your physiological strain and optimal pacing. Training in similar conditions or using simulations to adjust your goal pace can build confidence and prevent you from hitting the wall on race day due to underestimated environmental stress. ☀️🌡️💨
These advancements represent a significant leap, transforming wearables from data logs into intelligent training partners, offering deeper insights for staying healthy and unlocking your full potential on race day. The future of distance running training is increasingly smart, leveraging technology to create more resilient, efficient, and successful athletes.
“`